A trader who created the widely used Bollinger Bands technical indicator believes Bitcoin (BTC) is close to kicking off a bullish breakout.
John Bollinger tells his 233,800 followers on the social media platform X that Bitcoin appears to be forming two bullish continuation patterns on the weekly time frame.
The trader shares a chart suggesting that Bitcoin needs to take out its diagonal resistance at $65,000 to confirm a pattern breakout.
“Nice little W pattern on the weekly BTCUSD chart. I drew a regression channel to highlight the flag that is forming. Bullish setup, awaiting confirmation.”
Based on the trader’s chart, he appears to suggest that the last line of defense for BTC bears is the range high of the Bollinger Bands, hovering at around $73,000.
Traders use the Bollinger Bands to identify potential periods of volatility expansion and determine whether an asset is overbought or oversold.
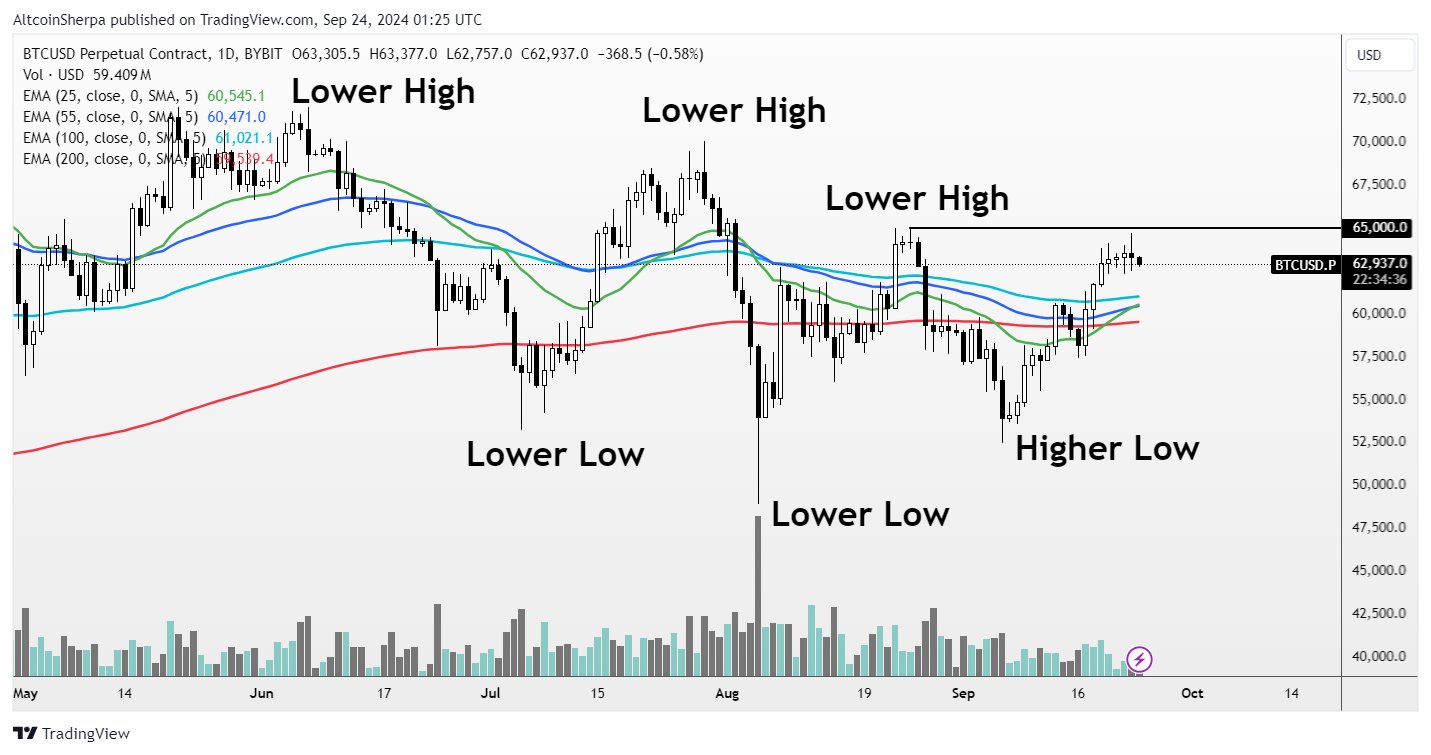
John Bollinger is not the only trader looking at the $65,000 area as a potential pivot point for Bitcoin. Pseudonymous analyst Altcoin Sherpa tells 223,400 followers on the social media platform X that Bitcoin will break its bearish market structure if it soars above the price level.
“BTC at a pivotal area – break $65,000 and we’ve established a higher high, thus breaking market structure on the one-day. One-day EMAs (exponential moving averages) also look pretty strong.”

Fellow analyst Josh Rager also sees a bull flag for Bitcoin with a trend-shift area at $65,000.
“Want to see price close higher before going more risk on.
Or just wait to add as the market plays out.
I think patience will be important over the next few weeks.”
At time of writing, Bitcoin is trading for $64,364.
Don’t Miss a Beat – Subscribe to get email alerts delivered directly to your inbox
Follow us on X, Facebook and Telegram
Generated Image: Midjourney
Read the full article here