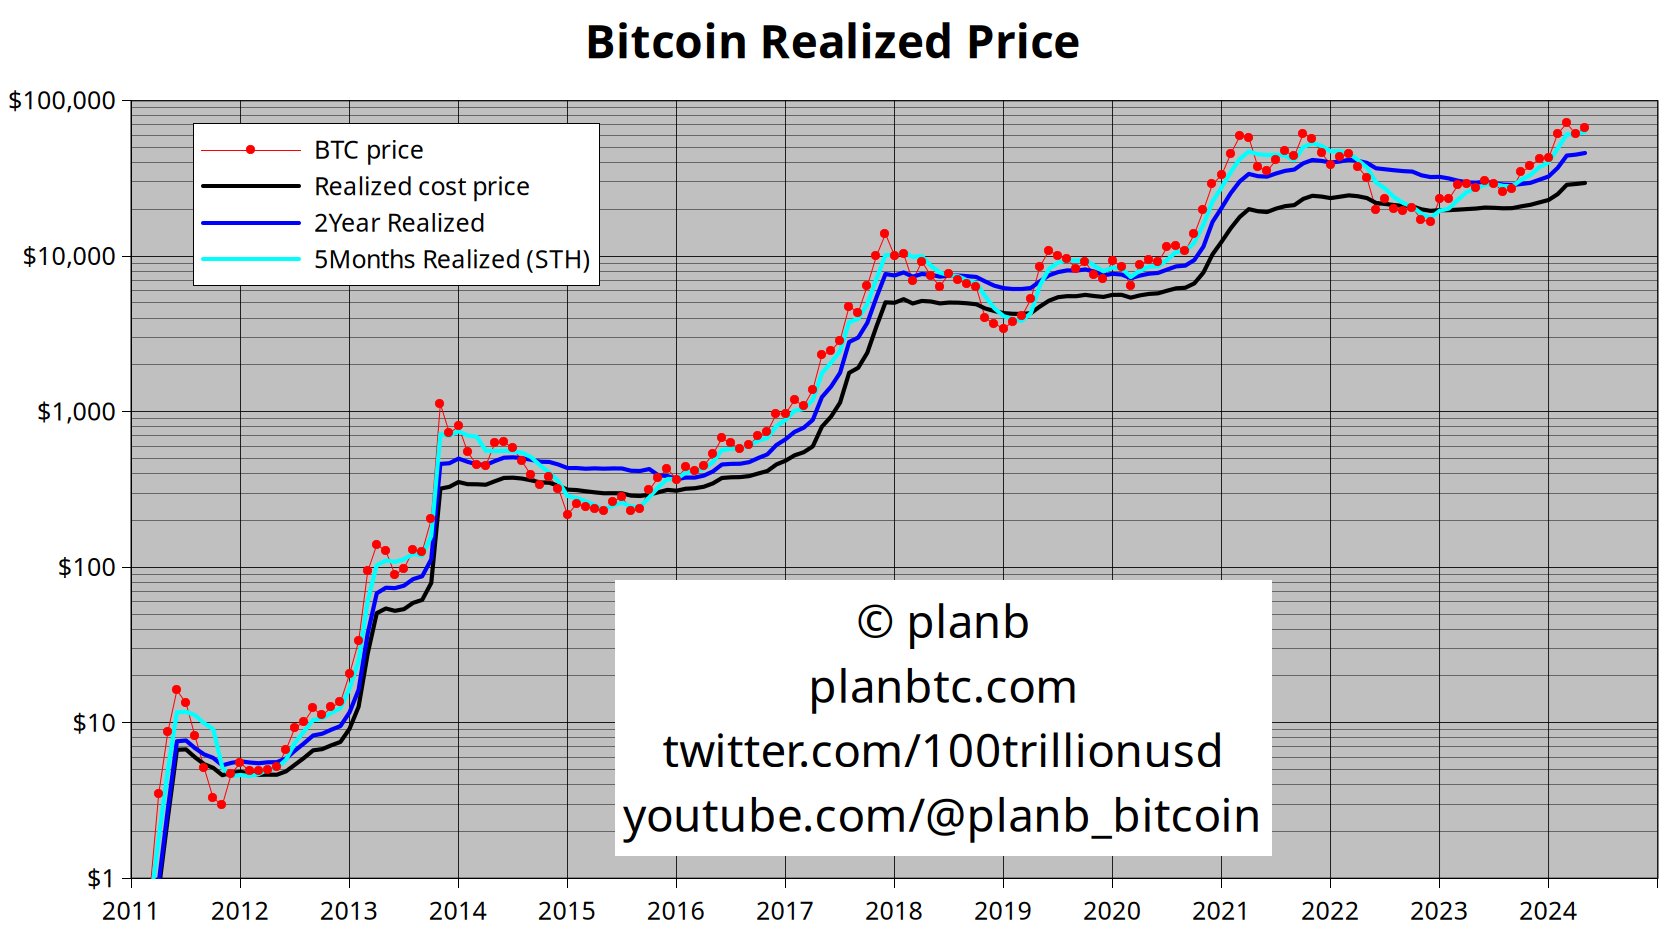
Well-known quant analyst PlanB says that Bitcoin (BTC) looks the same as it did in 2017 before witnessing a meteoric ascent.
PlanB tells his 1.9 million followers on the social media platform X that BTC is currently four months into its bull market phase, indicated by the four red dots on his chart.
“2017 vibes.”
Based on PlanB’s chart, the leading cryptocurrency by market cap was trading at around $1,200 when it was at its fourth red dot in 2017 but quickly rallied to the $20,000 mark by the end of the year.
The quant analyst is also looking at different variations of Bitcoin’s realized cost price indicator, which measures the value of a given cohort’s coins at the price they were last transacted. PlanB’s chart shows three variations of the metric including the five-month, two-year and total realized cost price of BTC.
The analyst’s chart also shows that BTC’s price is above all three metrics, suggesting that we may be seeing the final days of BTC trading at current levels.
“Last chance to buy Bitcoin below $70,000?”

PlanB also says that based on the historical correlation between miner revenue and price action, BTC should go “vertical” later in 2024 as the industry’s revenue recovers from the halving.
“Historically, Bitcoin miner revenue recovers two to five months after a halving, and after that Bitcoin price goes vertical.”
At time of writing, Bitcoin is trading at $67,105.
Don’t Miss a Beat – Subscribe to get email alerts delivered directly to your inbox
Follow us on X, Facebook and Telegram
Generated Image: DALLE3
Read the full article here