


Cryptocurrency trading can feel like navigating a maze, with endless data and hidden risks around every corner. Tools that simplify this chaos are game-changers, and that’s where platforms like Bubblemaps come in. Bubblemaps turns complex crypto token distributions and wallet connections into colorful bubble maps. This helps traders, investors, and even casual users spot trends, track whales, and verify project fairness in seconds.
This guide explains what Bubblemaps is and how to use Bubblemaps to analyze tokens, track whale moves, and boost your trading decisions with its unique features.
What is Bubblemaps?
Bubblemaps is a unique tool in the crypto world that makes blockchain data easy to grasp. It’s designed to visualize complex on-chain info – like wallet holdings and token transfers – in a simple, colorful way.
Imagine a map where each wallet is a bubble. The bigger the bubble, the more tokens that wallet holds. Lines connect bubbles when assets move between them, showing how tokens flow and who’s linked to who. This setup helps users spot patterns fast, like if a few wallets control most of a token’s supply or if shady activity’s afoot.

Built for DeFi tokens and NFTs, Bubblemaps pulls data from blockchains like Ethereum, BNB Chain, and Solana, covering the top 150 or 500 holders depending on the analysis. It’s a game-changer for digging into token distribution – say, catching a scam where one cluster hoards 40% of a coin. But it’s not just about red flags; it can also confirm legit projects, like when a central wallet’s meant to reward holders.
The platform’s got free and premium tiers. Anyone can check listed assets, but premium users scan any token by pasting its address. It’s tied into big DeFi names like DEX Screener and DEXTools and even works with chains like Avalanche and Arbitrum.
Features of Bubblemaps
- Bubble Visualization: Bubblemaps displays wallets as bubbles on a map. Each bubble represents a wallet, and its size shows how many tokens that wallet holds. This makes it simple to spot the biggest players in a project and understand token distribution at a glance.
- Wallet Connections: The tool connects bubbles with lines to show transactions between wallets. It is like a map of money flow, helping you see how tokens move and whether wallets are linked, which can reveal patterns like teamwork or manipulation.
- Cluster Detection: Bubblemaps highlights groups of wallets that work together, called clusters. This is useful for spotting if a few wallets control most of a token’s supply, which might signal a healthy project or a potential scam, depending on the context.
- Time Travel Feature: You can look back at past transactions with this feature. It is like a history button that lets you trace how tokens moved over time, giving you a clearer picture of a project’s activity and growth.
- Cross-Chain Support: Bubblemaps works with multiple blockchains, such as Ethereum, BNB Chain, and Avalanche. This means you can analyze tokens across different networks.
- Decentralization Score: Bubblemaps provides a decentralization score for tokens. This score measures how evenly a token’s supply is spread across wallets, helping you judge if a project is truly decentralized or controlled by a few big holders. A higher score means broader distribution, which often signals a healthier, less manipulated project.
- Top Holders Analysis: The tool lets you zoom in on the top holders of a token, typically the top 150 wallets. It is like a spotlight on the “whales” who own the most tokens, showing their share of the supply and any connections between them. This helps you understand who influences a token’s price or direction.
- Integration with Platforms: Bubblemaps connects seamlessly with popular DeFi platforms like DEX Tools. This integration means you can use its visuals directly within these tools, saving time and giving you real-time insights without switching apps.
Bubblemaps partners & past investigations
Bubblemaps partners with several key platforms to enhance its functionality and reach within the crypto community. It is integrated with DEX Screener, a popular DeFi charting tool, where its bubble maps are natively available for Solana-based tokens.
Moonscan, a blockchain explorer for the Moonbeam network, also incorporates Bubblemaps, allowing users to visualize token data directly for listed projects. NFTKey, a multi-chain NFT marketplace, announced native integration with Bubblemaps, enabling users to explore wallet connections within NFT collections. There are many other integrations and partnerships. These partnerships make Bubblemaps a versatile tool across DeFi and NFT spaces.
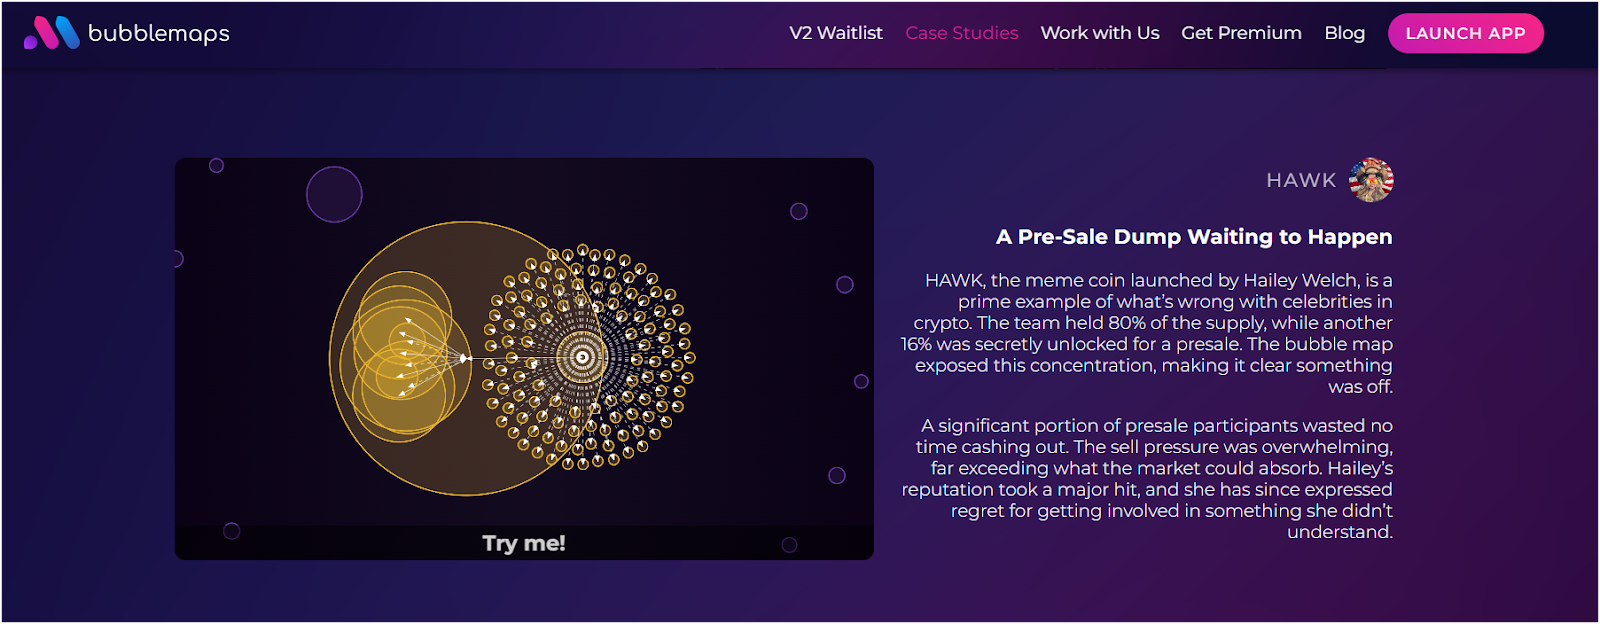
Past investigations by Bubblemaps showcase its ability to uncover shady practices. It exposed the Hawk Tuah (HAWK) token scam on Solana in 2024, showing 96% of the supply in a tight wallet cluster before a 95% price drop.
The tool also mapped out Sahil Arora’s celebrity meme coin schemes on Solana, revealing coordinated wallet activity behind multimillion-dollar pump-and-dumps. On Ethereum, Bubblemaps flagged the NEIRO token, where insiders sniped 78% of the supply at launch, later profiting $4.5 million.
Bubblemaps in the Solana and Ethereum Ecosystem
Bubblemaps plays a significant role in both the Solana and Ethereum ecosystems, offering visual insights into token dynamics. On Solana, it is heavily used to analyze token launches, especially on platforms like pump.fun. Its integration with DEX Screener provides real-time bubble maps for Solana tokens, helping users spot insider control or fair distributions.
On Ethereum, Bubblemaps thrives in DeFi and NFT analysis, though it lacks direct Etherscan integration. Its NEIRO investigation on Ethereum highlighted insider sniping, while other cases, like wash trading in NFTs, show its broad applicability.
How to Use Bubblemaps?
Step 1: Visit the Bubblemaps Website
You start by going to https://bubblemaps.io/. The homepage is your entry point. Now, go to “App” by clicking on the button in the top right corner. It shows a search bar and options to explore tokens or NFTs. You don’t need an account to begin, but premium features require signing up later.
Step 2: Find a Token or NFT to Analyze
You pick a cryptocurrency token or NFT collection you want to study. The search bar at the top is where you type the token’s name or contract address. For example, you might enter “SHIB” (Shiba Inu) or its Ethereum contract address. Bubblemaps supports multiple blockchains like Ethereum, Solana, and BNB Chain, so you can choose projects from different networks.
Step 3: Enter the Token Details
You input the specific token contract address if you have it. The contract address is a unique string of letters and numbers identifying the token on its blockchain. You find this on explorers like Etherscan or Solscan. Alternatively, you select the token from a dropdown list if Bubblemaps already recognizes it. You hit “Search” or press Enter to load the map.
Step 4: Explore the Bubble Map
Bubblemaps generates a visual map after you submit the token. Each bubble on the map is a wallet holding that token. The size of the bubble shows how many tokens the wallet owns—bigger bubbles mean more tokens. You see lines connecting bubbles, which represent transactions or links between wallets. You hover over a bubble to view details like the wallet address and token amount.
Step 5: Analyze Wallet Connections
You examine the connections between bubbles to understand token movement. Clusters of tightly linked bubbles suggest a coordinated activity, like a group of wallets controlled by one entity. This is key for spotting potential scams or insider trading. You check if a few big bubbles dominate the supply, indicating centralized control.
Step 6: Interpret the Data
You can conclude based on what you see. A decentralized token has many small, spread-out bubbles. A risky one might show a few giant bubbles linked tightly together. You use this to decide if a project is worth investing in or if it’s a potential rug pull.
The Bubblemaps Token (BMT)
BMT serves as both a governance and utility token for Bubblemaps. It debuted on March 11, 2025, to enhance community investigations and unlock premium features.
| Name | Bubblemaps |
| Ticker | BMT |
| Type | SPL & BEP20 (Solana & BNB Chain) |
| Max Supply | 1,000,000,000 |
| Circulating Supply on TGE | 25.6% |
| Contract Address (C/A) | Solscan, BscScan |
| Audit | Code4rena Zenith |
Bubblemaps Token TGE on DEX and Binance Wallet
On March 11, 2025, Bubblemaps conducted a Token Generation Event (TGE) on the BNB Smart Chain in collaboration with PancakeSwap. Users participated through the Binance Wallet, subscribing to BMT tokens with a total raise of $800,000. The event details were as follows:
- Token Name: BMT (Bubblemaps)
- Blockchain: BNB Smart Chain
- Subscription Period: March 11, 2025, from 8:00 AM to 10:59 AM UTC
- Total Raise: $800,000 (in BNB)
- Token Price: $0.02 per BMT (converted to BNB)
- Total Tokens Available: 40,000,000 BMT (4% of the total supply)
- Subscription Limit: Up to 3 BNB per Binance Wallet user
Note: You can buy BMT tokens on the best crypto exchanges like Binance, Bybit, Bitget, and MEXC.

Utility
BMT serves as the governance token of the Bubblemaps ecosystem. It provides users with access to exclusive features and community-driven investigations. With BMT, users can:
- Access Intel Desk, the first community-led blockchain investigation platform
- Submit cases, vote on important investigations, and allocate on-chain research resources
- Unlock premium analytics, including profit and loss tracking, cross-chain analysis, holder rankings, and AI-driven insights
Airdrop and Migration
Binance announced the inclusion of BMT in its HODLer Airdrops program. Users who subscribed their BNB to Simple Earn (Flexible and/or Locked) and/or On-Chain Yields products between March 2 and March 6, 2025, were eligible for the airdrop.
The total HODLer airdrop tokens amounted to 30,000,000 BMT, representing 3% of the maximum token supply. An additional 30,000,000 BMT will be allocated to HODLer airdrops in batches six months after the spot listing.
BMT launched on Solana and BNB Chain, with 88% of supply on Solana and 12% on BNB Chain. LayerZero tech allows BMT to move between these chains, but no major migration events have happened yet.
Alternatives to Bubblemaps
Here are three top alternatives to Bubblemaps
- Nansen: Nansen is a blockchain analytics platform that tracks on-chain data and wallet activity. It helps users spot trends, follow “smart money” (big investors), and analyze DeFi and NFT projects. The tool uses dashboards and real-time data, making it popular with traders and investors. Unlike Bubblemaps’ bubble visuals, Nansen focuses on detailed reports and wallet labeling. Check out our Nansen promo code “NFTevening” for a 23% discount.
- Dune Analytics: Dune Analytics lets users query and visualize blockchain data with custom dashboards. It’s great for crypto analysts and projects to track metrics like transaction volume or token holders. Users can create and share their own charts, offering flexibility over Bubblemaps’ preset bubble maps. It supports multiple blockchains like Ethereum and Polygon but requires some technical know-how.
- Glassnode: Glassnode provides in-depth on-chain data and metrics for over 100 crypto assets. It uses charts and tools to show trends like exchange flows, wallet balances, and market sentiment. Ideal for traders and researchers, it offers a more technical approach than Bubblemaps’ visual style. Its strength is historical data and advanced analytics, not playful visuals.
Final Thoughts: Why Bubblemaps is Important for Crypto Traders?
Bubblemaps is a blockchain visualization tool that transforms complex on-chain data into colorful, interactive bubble maps. It is designed to help users analyze wallet activity, token distributions, and connections in a simple way. You can use it to explore cryptocurrency projects and spot patterns like scams or whale movements.
Bubblemaps is important for crypto traders because it simplifies blockchain data with easy-to-read bubble maps. It shows token distribution and wallet connections that help traders spot whale activity or suspicious patterns.
Read the full article here


